 MACT
MACTFrom a blog post by Cayle Clarkson of Ticketpeak – reprinted with permission
In the wake of the COVID-19 pandemic, the world of musical theatre faced unprecedented challenges. However, amidst the uncertainty and disruptions, a group of musical theatre organizations have not only weathered the storm but emerged stronger than ever.
In this blog post, we delve into five years of musical theatre ticketing data to explore the remarkable resilience, grit and recovery of these organizations, shedding light on their revenue, event activity, attendance, and pricing strategies.
As the ticketing software provider for these musical theatre organizations, we examined data from 2019 to 2023 for a random set of 50 TicketPeak clients that were producing events in 2019 and in 2023. Revenues of these organizations ranged from $5,000 to $1.2 million per year.
Revenue
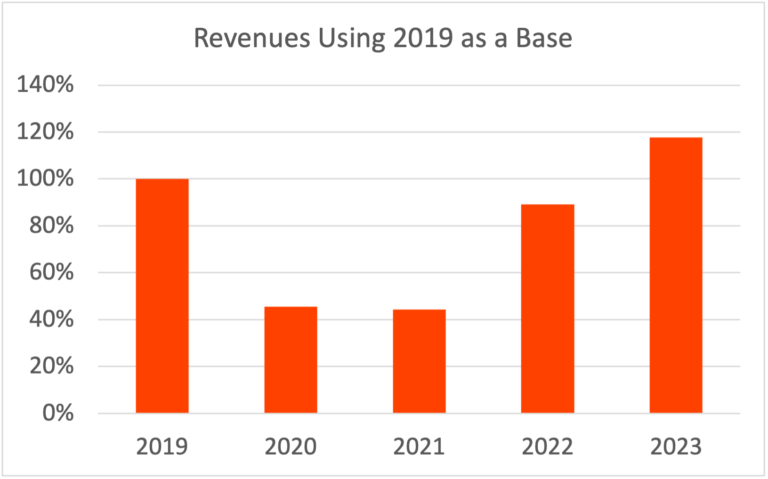
The most striking observation is that we’re back and stronger! In 2020 and 2021, COVID-19 cut revenues to approximately 40% of 2019 levels. However, in 2022, revenues nearly doubled from 2021, and in 2023, they even surpassed the pre-pandemic levels of 2019! This impressive recovery stands in contrast to industry reports suggesting that many musical theatre organizations are still struggling to sell tickets.
What did these winners do? During COVID-19, many of our clients produced virtual events, including training sessions, virtual shows, and even outdoor events. In some cases, the final product was a virtual viewing of a final video. These activities, while not as revenue-producing as live shows, kept their staff in place and their patrons engaged.
They also leveraged email marketing and social media to keep their patrons interested. When COVID-19 restrictions were eased, they returned fast to in-person events using social distancing. They were chomping at the bit to do so. When restrictions were lifted entirely, they were entirely ready to sell tickets and fill seats in the regular manner.
The very high performers offered significant pricing differentiation – some as many as eight different price levels (four seating sections times two demographic prices for each). This pricing approach enabled them to offer premium seats to those who wanted to pay more and fill less desirable seats with patrons who were more budget-conscious. (Download our free Event Revenue Booster Guide.)
Number of Events
While it’s no surprise that the number of events declined in 2020 and 2021, the extent of the drop was not huge. Despite the challenges, these musical theatres continued to host events as described above. In 2019 – pre-COVID 19, the average number of events per organization was 6.2. It dropped to 5.4 in 2020 and further to 4.8 in 2021. The point is, for these guys, it didn’t drop to zero, although there was a shift to virtual. Activity bounced back in 2022, with an average of 6.6 events per organization, remaining steady in 2023.
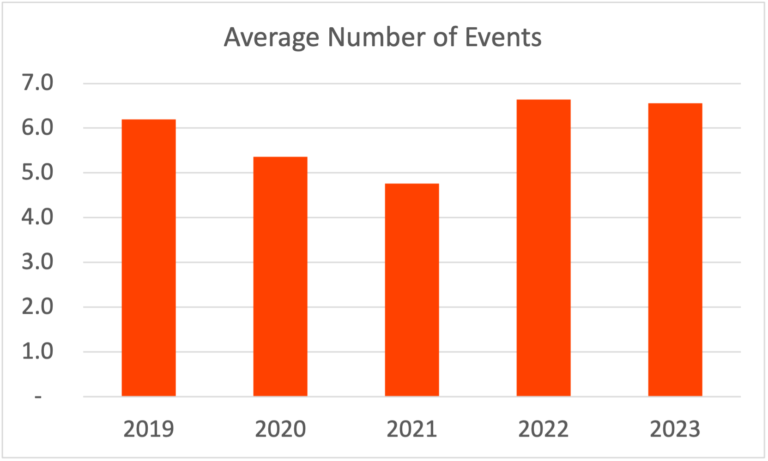
So, while revenue has surpassed 2019 levels, that increase is not from more events. These clients are getting there by increasing attendance per event.
Attendance
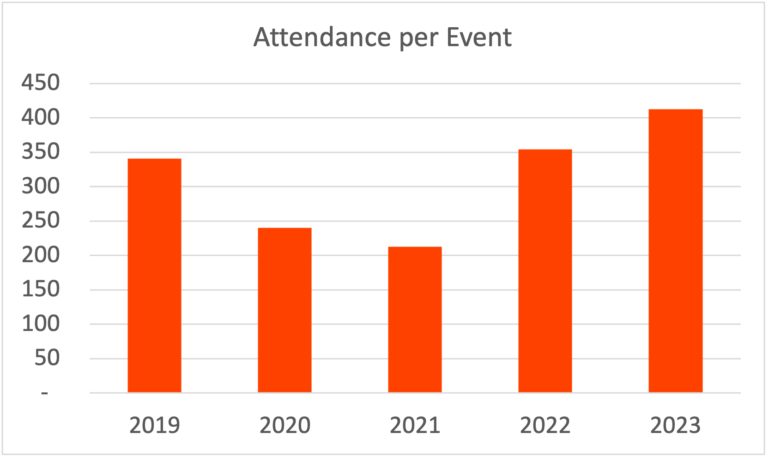
The musical theatre ticketing data shows that attendance, like revenue and event count, saw significant declines in 2020 and 2021. Pre-COVID-19, these performing arts organizations averaged 350 attendees per event (across multiple performances of each event). Attendance fell to approximately 240 in 2020 and 200 in 2021. The remarkable part of the story is the resurgence in 2022, climbing back to 350 attendees per event and exceeding 400 in 2023! Clearly, these organizations have successfully enticed audiences back to their performances, showcasing their ability to adapt and innovate.
Ticket Prices
One intriguing observation is that ticket prices did not decrease during the COVID-19 pandemic. Instead, they steadily increased from 2019 to 2023. The higher prices in 2020 and 2021 can be attributed to organizations transitioning to virtual events, classes, and seminars, which often command higher ticket prices. It’s reassuring to see that ticket prices have kept pace with inflation, indicating the value placed on these cultural experiences.

Conclusion
n the face of unprecedented challenges brought about by the COVID-19 pandemic, these performing arts organizations have not only survived but thrived. Their remarkable recovery in revenue, ability to maintain activities, and success in bringing back audiences illustrate their resilience and adaptability. Moreover, the consistency in ticket price increases reflects the enduring value of the arts to their patrons.
The ticketing data from this group of musical theatre are not necessarily representative of the entire musical theatre industry, but it is great to see that growth opportunities are there.
Interested in driving growth to your events? Download this free scorecard: 5 Easy Ways to Boost Event Revenue.