 MACT
MACTProvided by AmericansForTheArts.org
As counted by the U.S. Bureau of Labor Statistics, there are 2.67 million artists in the U.S. workforce—1.6% of all workers. The unemployment rate for artists grew from 3.7% in 2019 to 10.3% in 2020 due to the pandemic — and has since decreased to 3.9% in 2022.
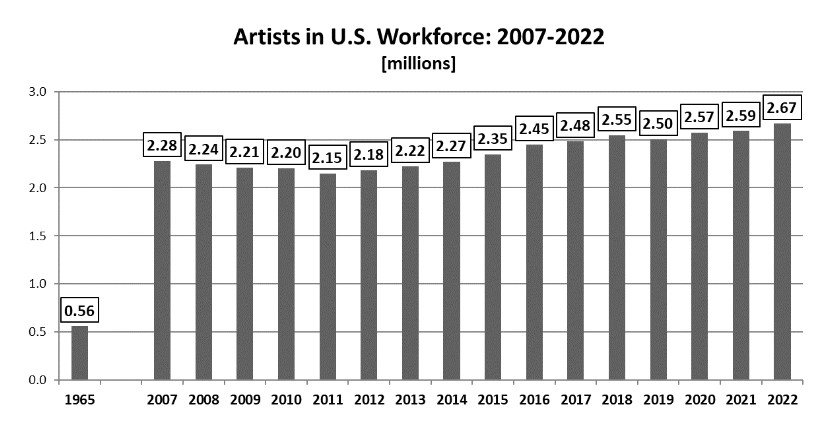
- The U.S. Bureau of Labor Statistics (BLS) reports that there were 2.67 million artists in the U.S. workforce in 2022—representing 1.6% of all workers ages 16 and older.
- In 2022, the unemployment rate for artists was 3.9%, an ongoing improvement from 10.3% in 2020, which was up significantly due to the pandemic. In 2019, artist unemployment was 3.7% The 2022 unemployment rate for artists remains higher than “Professionals” (2.1%), a category of workers that includes artists and other occupations that generally require college training. The 2022 unemployment rate for the total workforce was 3.4% (down from 7.8% in 2020).
- It is important to note that this analysis of the artist labor force is comprised of just 11 occupational categories: architects; art directors, fine artists, and animators; designers; actors; producers and directors; dancers and choreographers; musicians; announcers; writers and authors; photographers; and other artists and entertainers. While these categories only capture a portion of all artists in the workforce, this methodology has been used by the federal government for over 50 years, which makes it a valuable artist employment trend.
- Also noteworthy is that this is an analysis solely of artist employment. It does not include arts-related jobs such as arts administrators, curators, technical staff, and fundraisers.
Source: National Endowment for the Arts, Office of Research & Analysis, and the U.S. Bureau of Labor Statistics, 2023.